
Custom reports & analytics
Saved, chartable reports on job volume, turnaround time and revenue — build the view you actually want to check, not a fixed dashboard someone else decided was useful.
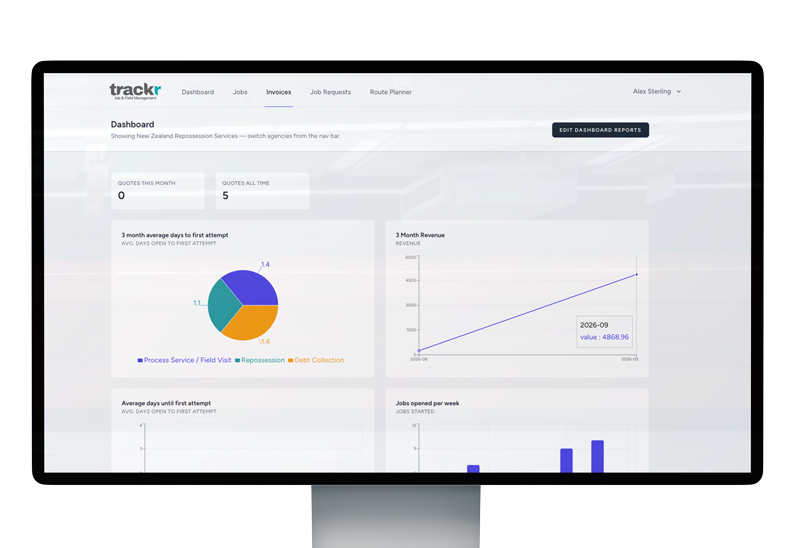

A dashboard someone else designed rarely answers the specific question you actually have this month — how many jobs opened and closed in a given period, how long jobs are taking from open to close, or what you actually collected.
Trackr’s reports are built and saved by you: chartable views (bar, line, pie, number or table) over job volume, turnaround timing and revenue, filtered by date range, kept for whenever you want to check them again, rather than exported to a spreadsheet and rebuilt from scratch each time. Revenue is staff-only — agents and clients never see it, same as invoices generally.
Why job volume and turnaround matter to running the agency
Referrers in process serving, repossession and debt collection often care about turnaround as much as outcome — how quickly a job moved from open to closed matters to a law firm or finance company deciding who to send the next batch of work to. Being able to chart that over a chosen date range, rather than guessing at it from memory or digging through individual jobs one at a time, is what turns “we’re generally pretty fast” into a number an agency can actually stand behind in a conversation with a client.
What it looks like in practice
A report is something you build once and keep, not something you reconstruct every time you want to check it. Pick job volume, turnaround time or revenue as the underlying metric, choose bar, line, pie, number or table as the view, set a date range, and save it. From then on it’s there whenever you want to look — a fixed dashboard someone else designed doesn’t need to anticipate every question an agency might have, because you’re the one deciding what gets tracked.
Why revenue stays staff-only
Revenue reporting follows the same visibility rule as invoices generally: agents and clients never see it. Field agents need to know what job they’re doing and where, not what it’s billing at, and clients are dealing with an agency, not auditing its internal finances. Keeping revenue reporting restricted to staff means the same reporting tool can be opened up more broadly for volume and turnaround — the metrics that are useful to look at as a team — without exposing figures that were never meant to be shared that widely.
How this differs from exporting the raw data
Reports and data export are answering different questions from the same underlying jobs. A saved report is for watching a trend over time at a glance — is turnaround improving, is job volume up this quarter — without leaving Trackr. Exporting is for when you need the underlying rows themselves, to hand to an accountant, build something custom in a spreadsheet, or satisfy a one-off request from a client. Most agencies end up using both: reports for the ongoing view, export for the specific ask.